Our ABG calculator (also searched as abgs calculator or abg interpretation calculator) helps you interpret arterial blood gases quickly and consistently. Enter pH, PaCO₂, and HCO₃⁻, select US (mmHg, mEq/L) or SI (kPa, mmol/L), and the tool identifies the likely primary disorder, flags mixed processes, and applies standard compensation formulas. It’s designed for bedside use in emergency, ICU, anesthesia, and ward settings where calculating ABGs accurately saves time.
ABG Calculator
We have a guide on ABG calculator as well;
Explore more nephrology calculators:
What an ABG shows (and why it matters)
An arterial blood gas reports the acid–base and ventilatory state in real time. The core values are:
- pH (acid–base status),
- PaCO₂ (respiratory component),
- HCO₃⁻ (metabolic/renal component), ± base excess and oxygenation metrics.
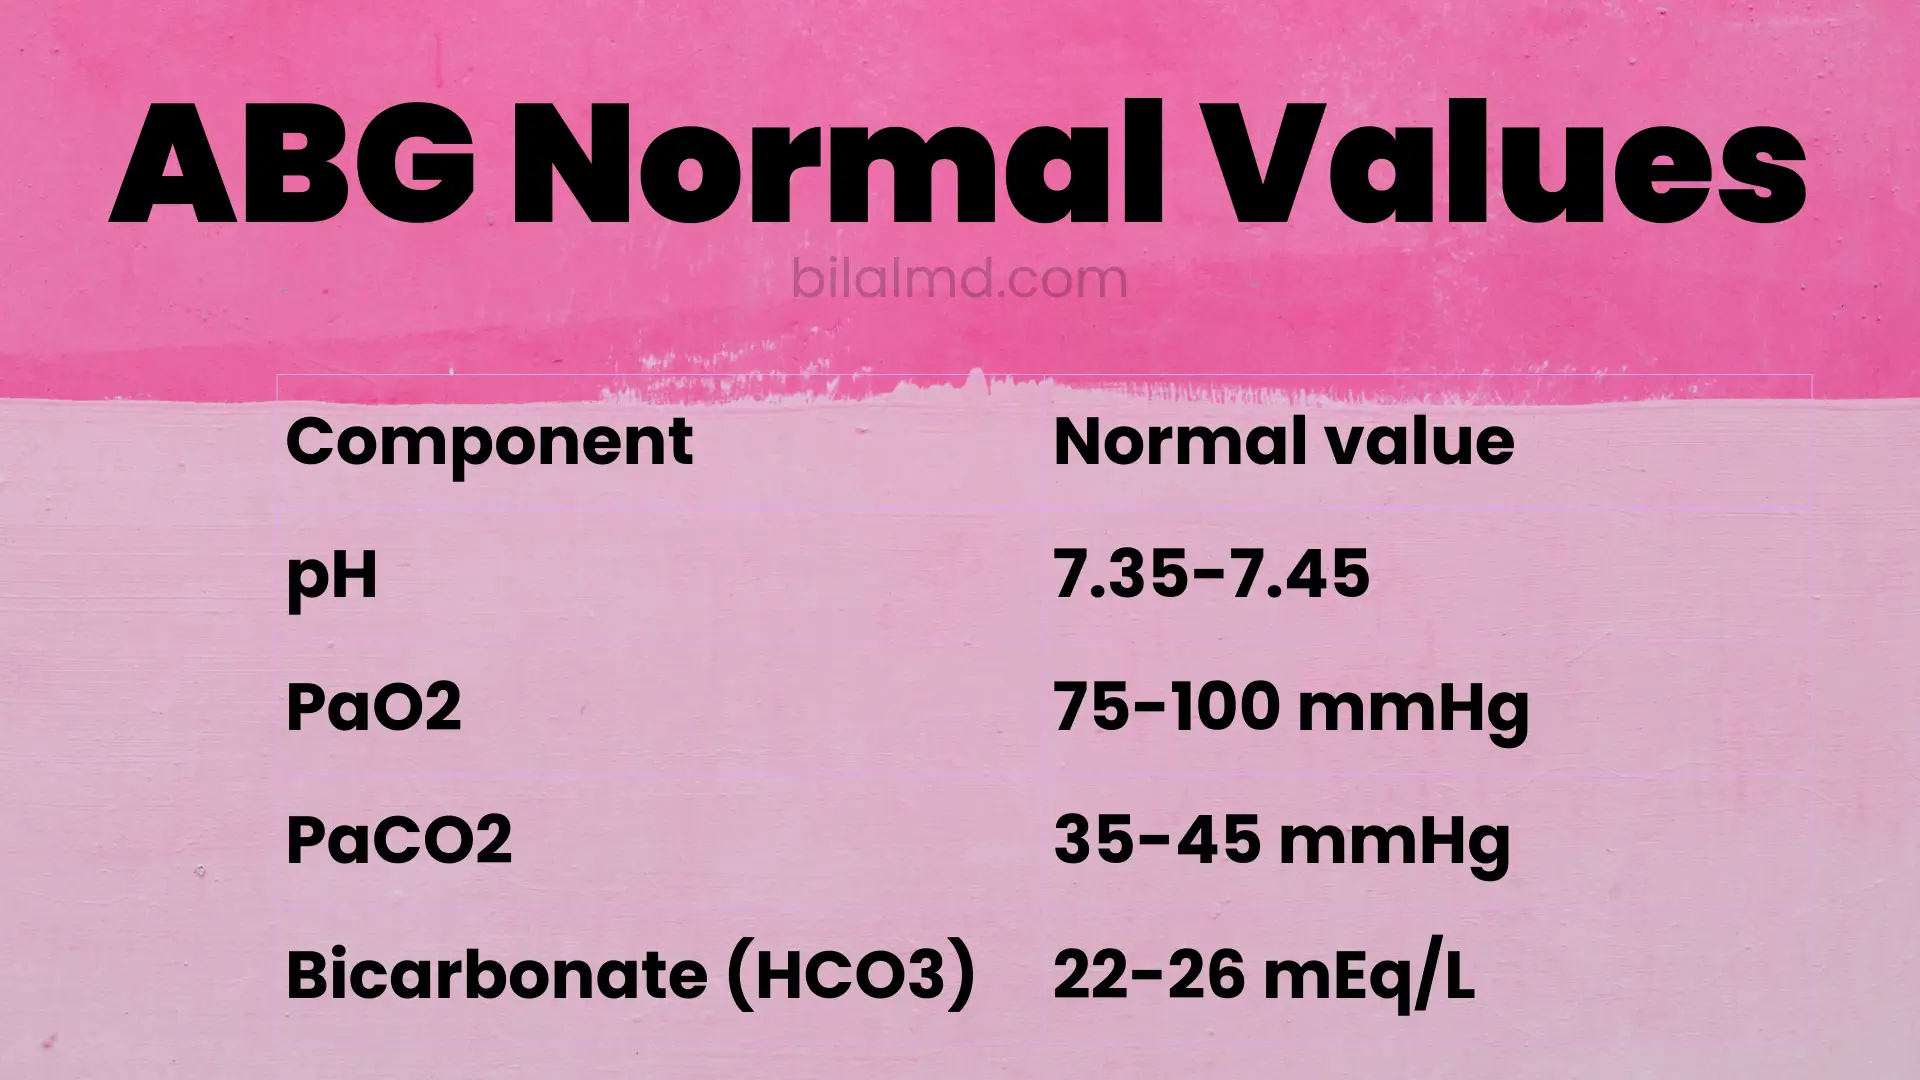
Typical adult reference intervals are- pH 7.35–7.45,
- PaCO₂ 35–45 mmHg (≈ 4.7–6.0 kPa),
- HCO₃⁻ 22–26 mEq/L (mmol/L).
Because pH reflects the balance between lungs (PaCO₂) and kidneys (HCO₃⁻), a systematic read tells you whether the disturbance is respiratory or metabolic, whether compensation is appropriate, and if a second process is present.

ABG calculation formula (what the tool applies)
Under the hood, acid–base relationships arise from Henderson–Hasselbalch (pH depends on HCO₃⁻/PaCO₂), but at the bedside we rely on compensation equations to judge whether numbers fit a simple disorder or indicate a mixed one. The calculator uses the most cited rules:
- Metabolic acidosis (Winters’ formula) expected PaCO₂
PaCO₂ (expected) = 1.5 × HCO₃⁻ + 8 (±2). If measured PaCO₂ is higher, there’s concomitant respiratory acidosis; if lower, concomitant respiratory alkalosis. - Metabolic alkalosis expected PaCO₂
PaCO₂ (expected) ≈ 0.7 × HCO₃⁻ + 20 (±5). Hypoventilation raises PaCO₂, but wide variation exists clinically use this as a guide. - Respiratory disorders expected HCO₃⁻ change (acute vs chronic)
For each 10 mmHg rise/fall in PaCO₂ from 40:- Acute respiratory acidosis: HCO₃⁻ ↑ ~1 mEq/L
- Chronic respiratory acidosis: HCO₃⁻ ↑ ~3–4 mEq/L
- Acute respiratory alkalosis: HCO₃⁻ ↓ ~2 mEq/L
- Chronic respiratory alkalosis: HCO₃⁻ ↓ ~4–5 mEq/L
(Compensation never fully normalizes pH.)
The tool also normalizes units (kPa ↔ mmHg) with the standard factor 1 kPa = 7.50062 mmHg so you can switch regions without mental arithmetic.
How to interpret an ABG (step-by-step)
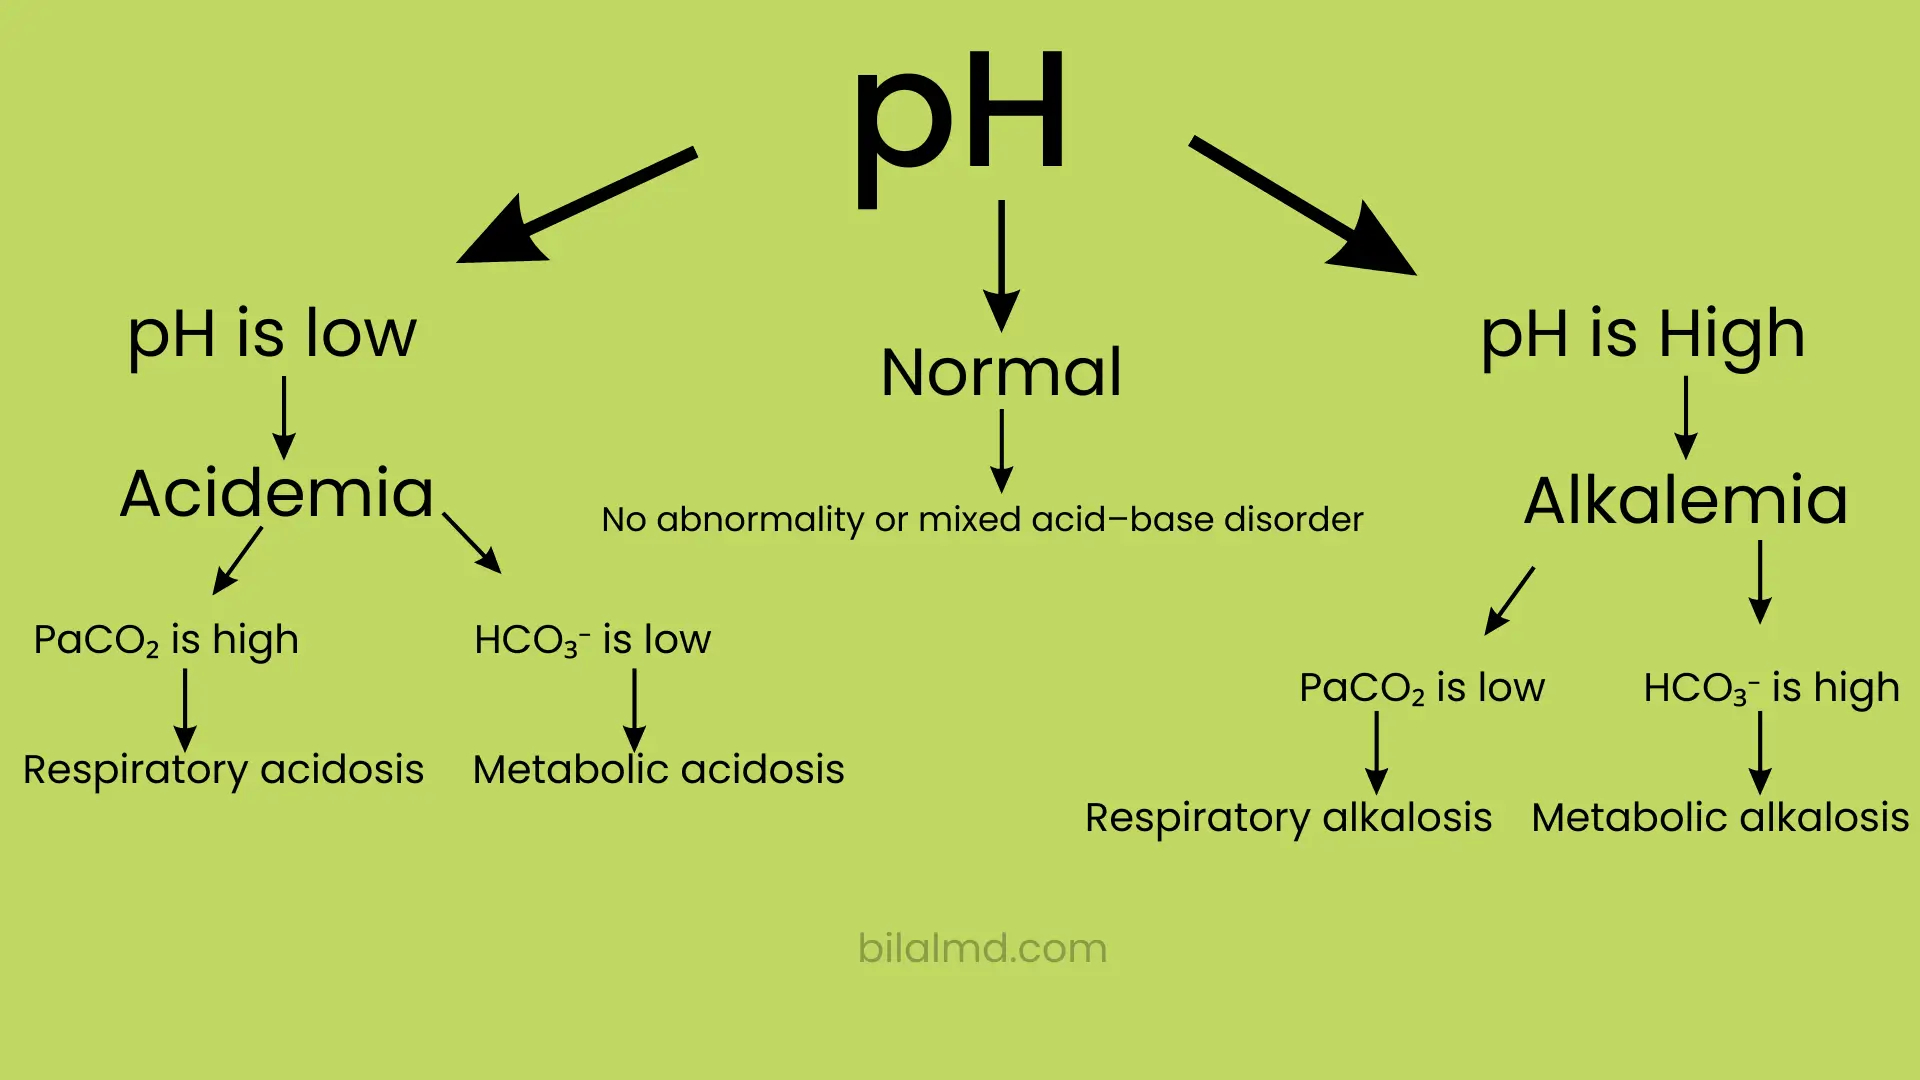
- Check pH
- < 7.35 = acidosis
- > 7.45 = alkalosis. This sets the overall direction.
- Identify the primary system
- If pH and PaCO₂ move in opposite directions (↓pH, ↑PaCO₂ or ↑pH, ↓PaCO₂), the primary disorder is respiratory.
- If pH and HCO₃⁻ move in the same direction (↓pH with ↓HCO₃⁻ or ↑pH with ↑HCO₃⁻), the primary disorder is metabolic.
- Ask: is compensation appropriate?
- Apply Winters’ (metabolic acidosis), 0.7×HCO₃⁻ + 20 (metabolic alkalosis), or the acute/chronic respiratory tables above. A mismatch signals a second process (mixed disorder).
- Consider likely causes
- Metabolic acidosis → check anion gap and lactate/ketones; respiratory acidosis → hypoventilation/COPD/neuromuscular; metabolic alkalosis → volume/Cl⁻ status; respiratory alkalosis → hyperventilation/hypoxemia. (Your clinical context and trend matter as much as the single number.)
ABG interpretation chart
| Primary process | pH | PaCO₂ | HCO₃⁻ | “Quick check” for expected compensation |
|---|---|---|---|---|
| Metabolic acidosis | ↓ | ↓ (compensation) | ↓ | Winters: PaCO₂ ≈ 1.5×HCO₃⁻ + 8 (±2) |
| Metabolic alkalosis | ↑ | ↑ (compensation) | ↑ | PaCO₂ ≈ 0.7×HCO₃⁻ + 20 (±5) |
| Resp. acidosis | ↓ (less) | ↑ (primary) | ↑ ~3–4 mEq/L per +10 PaCO₂ | Larger HCO₃⁻ rise over days |
| Resp. alkalosis | ↑ (less) | ↓ (primary) | ↓ ~4–5 mEq/L per –10 PaCO₂ | Larger HCO₃⁻ drop over days |
Worked mini-examples
Example 1 metabolic acidosis with appropriate respiratory compensation
- pH 7.28, HCO₃⁻ 16 mEq/L, PaCO₂ 28 mmHg.
- Winters: expected PaCO₂ = 1.5×16 + 8 = 32 ±2. Measured is 28 → slightly lower than expected (coexisting respiratory alkalosis is possible, common in sepsis).
Example 2 metabolic alkalosis
- pH 7.52, HCO₃⁻ 34 mEq/L, PaCO₂ 45 mmHg.
- Expected PaCO₂ ≈ 0.7×34 + 20 = 43.8 ±5 → 45 fits, so a simple metabolic alkalosis with appropriate hypoventilation is likely.
Example 3 acute respiratory acidosis
- pH 7.28, PaCO₂ 60 mmHg → ΔPaCO₂ = +20 from 40; acute HCO₃⁻ rise ≈ +2 mEq/L → HCO₃⁻ ~26 predicted. If HCO₃⁻ actually measures 30, think chronic component or a mixed process.
Units: mmHg ↔ kPa (for global use)
Clinicians in the UK/EU/AUS often record PaCO₂ in kPa; North America commonly uses mmHg. The calculator accepts either and converts using 1 kPa = 7.50062 mmHg, so your interpretation logic is consistent regardless of local practice.
ABG interpretation practice: quick self-checks
- Do the direction of pH and the primary variable (PaCO₂ or HCO₃⁻) agree? (ROME: Respiratory Opposite, Metabolic Equal a memory aid, not a law.)
- Does your expected compensation match the measured value? If not, suspect a mixed disorder.
- Are the numbers plausible (e.g., extremely low PaCO₂ with only mild alkalemia)? Re-check inputs and consider sampling/analysis issues.
For a fuller walkthrough including abg interpretation chart variants, abg interpretation practice questions, and case vignettes read our blog companion:
FAQs (ABG tool)
How do I use the ABG calculator?
Enter pH, PaCO₂, and HCO₃⁻, choose mmHg/mEq/L or kPa/mmol/L, then tap Analyze. The tool classifies the primary disorder and checks whether the compensation (Winters, metabolic alkalosis rule, or respiratory acute/chronic tables) fits a single or mixed process.
What are normal ABG values?
Adults typically: pH 7.35–7.45, PaCO₂ 35–45 mmHg (4.7–6.0 kPa), HCO₃⁻ 22–26. Your lab’s ranges may vary slightly.
What is the ABG calculation formula for compensation?
Metabolic acidosis: PaCO₂ ≈ 1.5×HCO₃⁻ + 8 (±2)
Metabolic alkalosis: PaCO₂ ≈ 0.7×HCO₃⁻ + 20 (±5)
Respiratory (acute/chronic): see the HCO₃⁻ change per ±10 mmHg PaCO₂ in the chart above.
Is this useful for nursing/bedside teams?
Yes interpreting ABGs made easy depends on having a repeatable process. The calculator standardizes steps and applies the same rules every time, which is helpful in nursing, respiratory therapy, and junior doctor practice. Pair it with unit conversion and your local policies.
Can compensation ever fully normalize pH?
No compensation rarely returns pH to perfect normal; if pH is fully normal, suspect chronicity or a mixed disorder balancing out.
Key sources
- StatPearls (ABG; PaCO₂ basics; normal ranges) stepwise interpretation, reference intervals, and clinical context.
- LITFL (Blood gas interpretation series) 5-step approach; compensation rules; disorder-specific pages.
- UCSF Hospital Handbook / Merck / ATS quick tables for acute/chronic respiratory compensation and Winters’ checks. https://hospitalhandbook.ucsf.edu/