Use the PISA calculator to turn color Doppler measurements into hard numbers. Enter the aliasing velocity, the PISA radius, and the MR spectral data to compute effective regurgitant orifice area and regurgitant volume with transparency and clinical rigor. Below is a walkthrough of the equations, measurement steps, interpretation thresholds, and the traps that cause bad numbers
PISA Calculator – Regurgitant Flow & EROA
Explore more heart calculator:
What the PISA method measures and why it matters
PISA stands for proximal isovelocity surface area. When blood accelerates toward a regurgitant orifice, it forms hemispheric shells of equal velocity on the ventricular side. If you know the shell area and the aliasing velocity from color Doppler, you can compute the flow rate. From that, you can derive effective regurgitant orifice area (EROA) and regurgitant volume (RV), the two most decision-relevant metrics for mitral regurgitation. In practice, the core relations are:
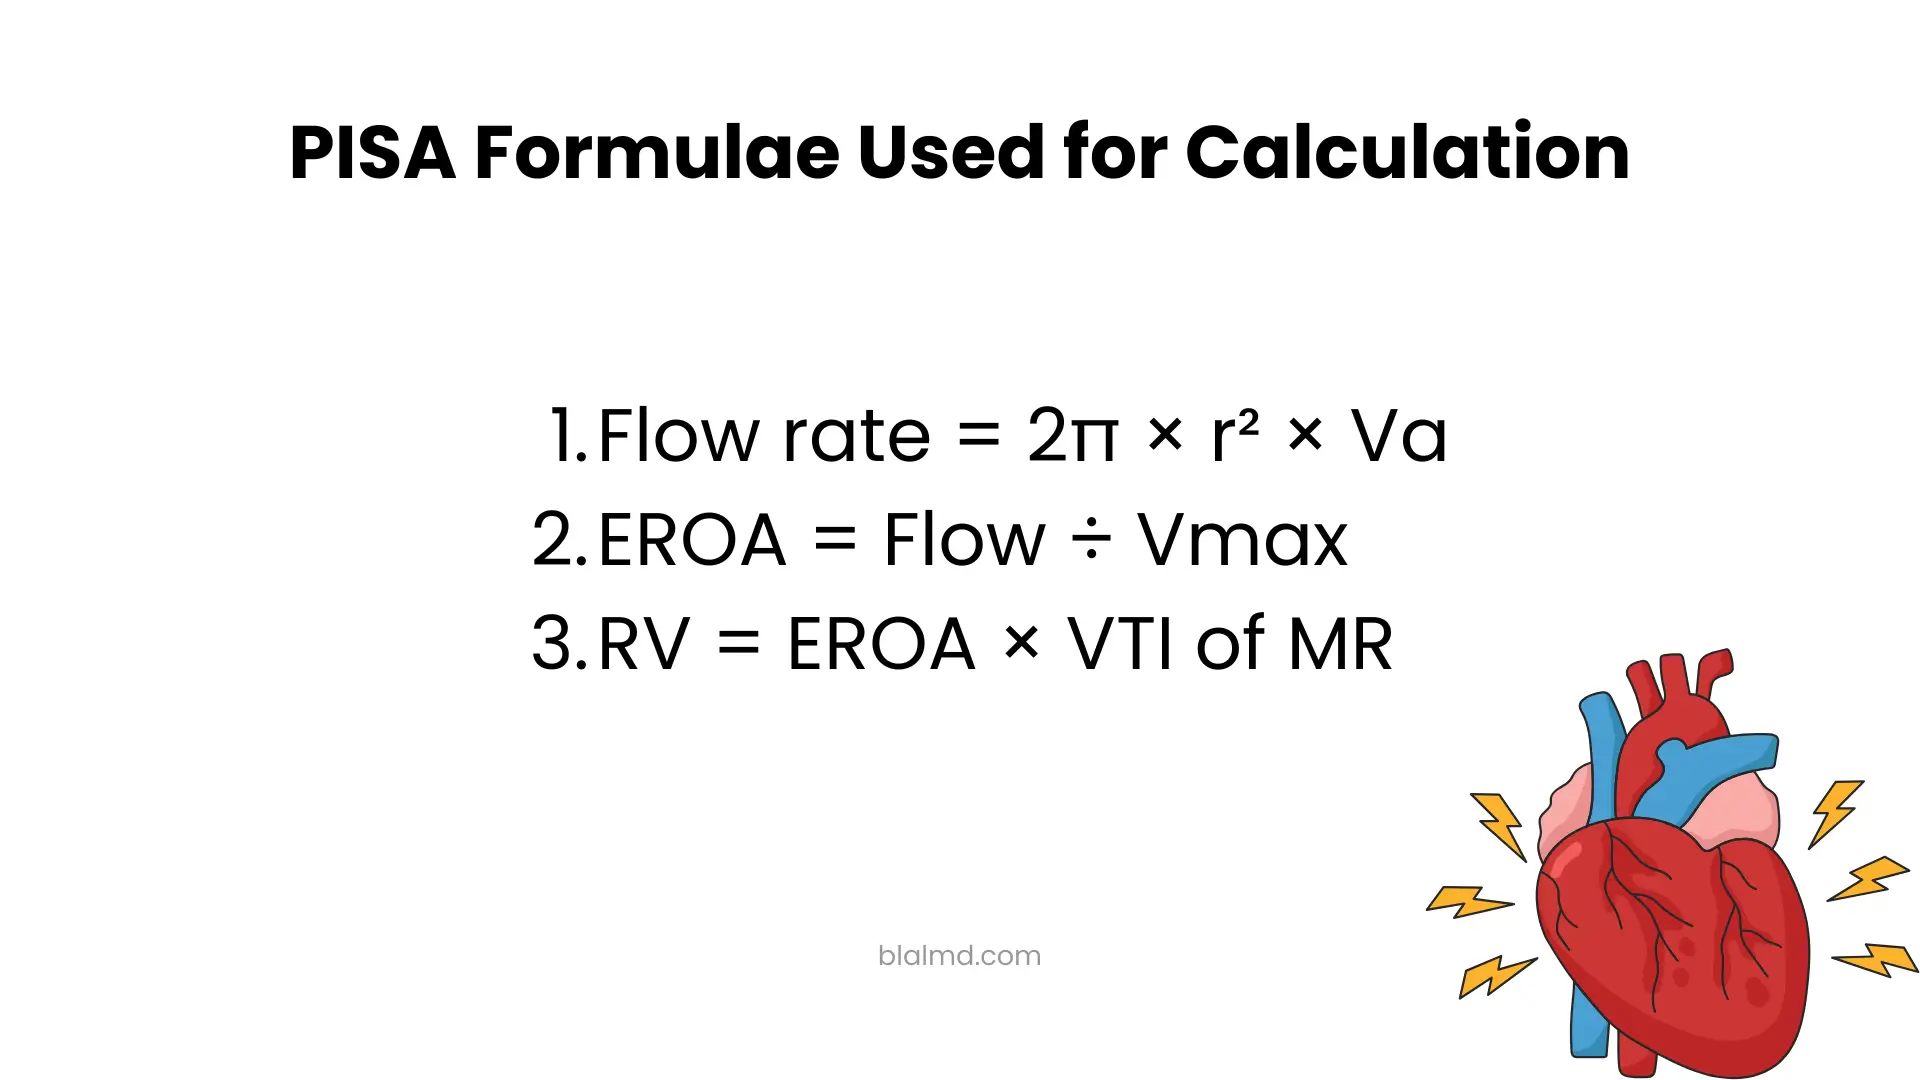
- Flow rate = 2π × r² × Va
- EROA = Flow ÷ Vmax
- RV = EROA × VTI of MR
Here, r is the radius from the orifice to the first aliasing boundary,
Va is the aliasing velocity set by the Nyquist limit,
Vmax is the peak MR velocity from CW Doppler,
VTI of MR is the velocity–time integral of the MR jet. These equations are standard in contemporary echo guidance and reviews.
The core formula set you will use in the calculator
- Flow rate (mL/s)
Q=2πr2⋅Va
Use centimeters for r and centimeters per second for Va to keep units consistent. - Effective regurgitant orifice area (EROA, cm²)
EROA=VmaxQ=Vmax2πr2⋅Va - Vmax comes from continuous-wave Doppler through the MR jet.
- Regurgitant volume (RV, mL/beat)
RV=EROA×VTIMR - The VTI is traced on the CW envelope of the MR jet.
- Many labs also show a simplified form used in teaching: if Vmax ≈ 500 cm/s and Va ≈ 40 cm/s, then EROA ≈ r²/2. It is a helpful mental check, not a substitute for the actual calculation.
How to perform PISA measurement correctly
1) Optimize color Doppler
Zoom on the regurgitant valve, narrow the color sector, lower the depth, and adjust the Nyquist limit so the hemispheric aliasing shell is clear. You are trying to produce a crisp, near-hemisphere on the ventricular side.
2) Pick the best frame
Freeze and scroll to mid-systole when the shell is largest and best defined. Measure several beats and average, especially in irregular rhythms, because beat-to-beat variability can be around 15 percent.
3) Measure the PISA radius
From the vena contracta center to the first aliasing boundary along the direction of the flow convergence. Precision matters because r is squared in the formula.
4) Record aliasing velocity
Use the scale shown on the color map at the Nyquist limit. That value is Va in the equations.
5) Obtain spectral data
Align CW Doppler with the MR jet to get Vmax and trace the VTI over systole. These go straight into EROA and RV.
Worked examples
Example A: full calculation
- PISA radius r = 0.9 cm
- Aliasing velocity Va = 38 cm/s
- Peak MR velocity Vmax = 500 cm/s
- MR VTI = 120 cm
Interpreting EROA and regurgitant volume
For primary MR, many references consider EROA ≥ 0.40 cm² or RV ≥ 60 mL consistent with severe disease, whereas minor lesions fall below EROA 0.20 cm² or RV 30 mL. Always integrate with other signs like vena-contracta width, pulmonary vein flow, chamber size, and symptoms. Thresholds depend on etiology and the guidance document you follow.
When the hemisphere assumption breaks and what to do
The classic PISA assumes a hemisphere. Real anatomy and flow are messy. Orifices can be elliptic or irregular, jets can hug the wall, and the convergence shell can flatten at low driving velocities. All of these distort the hemisphere and bias EROA. Solutions include:
- Angle correction when the flow convergence is truncated by leaflets or walls.
- Lowering or raising Va to improve hemispheric shape.
- Three-dimensional PISA, which sums true surface areas instead of assuming geometry.
- Confirmatory quantification using alternative methods if the result contradicts the clinical context.
These limitations and remedies are well documented in mechanistic and validation studies and are emphasized in guideline documents.
Step-by-step checklist you can follow at the machine
- Acquire a zoomed parasternal long-axis or apical view with the MR jet fully in view.
- Reduce depth and sector width, optimize color gain, and set Nyquist to establish a sharp aliasing boundary.
- Freeze at mid-systole and measure r from the orifice center to the aliasing boundary along the inflow axis.
- Note Va from the color scale.
- Use CW Doppler along the jet to read Vmax and trace VTI.
- Enter r, Va, Vmax, and VTI into the calculator to get flow, EROA, and RV.
- Integrate with other parameters and the clinical picture before labeling severity.
How the calculator handles units and common edge cases
- Units: Keep r in centimeters, Va and Vmax in cm/s, VTI in cm. The outputs are EROA in cm² and RV in mL/beat by construction.
- Multiple jets: Calculate each jet separately; the total EROA is the sum of the jets are independent. Confirm with integrative methods.
- Eccentric or wall-hugging jets: Expect PISA to underestimate severity; corroborate with vena contracta area or volumetric methods, and consider 3D.
- Functional MR: Thresholds can shift because orifice shape and dynamics differ from primary MR. Again, interpret within guideline frameworks.
FAQs
What is PISA in echocardiography?
It is the proximal isovelocity surface area formed by accelerating blood proximal to a regurgitant orifice. Measuring its radius and the aliasing velocity lets you calculate flow and, from that, EROA and regurgitant volume.
Which numbers are needed for a PISA calculation
Radius of the aliasing shell, aliasing velocity from the color scale, peak MR velocity by CW Doppler, and the MR VTI. The calculator uses those to output EROA and RV.
Why do some echo labs talk about EROA equals r-squared over two
It is a teaching shortcut that assumes a typical ratio of aliasing to peak MR velocity. It is useful for a quick check but not a replacement for the full formula.
Does PISA work for valves other than the mitral valve
Yes, the concept applies to other regurgitations as well, but geometry, jet direction, and measurement windows change. Follow valve-specific guidance and corroborate with other methods.
When should I use 3D PISA?
When the hemisphere assumption is clearly violated or when results are discordant with clinical and other quantitative data. 3D PISA measures the true surface area and can reduce geometric error.
Where PISA fits inside guideline-based assessment
PISA is recommended as part of a multiparametric assessment rather than a stand-alone verdict. Combine EROA and RV with vena-contracta width or area, pulmonary vein flow, chamber remodeling, and the clinical picture when you classify severity and decide therapy. Major society documents emphasize this integrative approach.
Practical pitfalls that destroy accuracy
- Measuring r off-axis or from the wrong anchor point
- Using a fuzzy aliasing boundary because the Nyquist limit is not optimized
- Failing to average multiple beats in atrial fibrillation
- Trusting a single method when results do not match symptoms or other echo signs
Each of these is a known source of error in the literature and in daily practice. When in doubt, re-measure and corroborate.
Safety note
This calculator is a learning and documentation aid. It does not replace physician judgment, institutional protocols, or comprehensive guideline-driven evaluation. Treatment decisions for regurgitant valve disease must consider all quantitative and qualitative data, patient symptoms, comorbidities, and procedural risk.
References and further reading
- ESC E-Journal of Cardiology Practice. PISA formulas, thresholds for EROA and RV, and a step-by-step overview.
- ASE 2017 Valvular Regurgitation Recommendations. Society guidance on quantifying regurgitation, including PISA and integrative assessment.
- Circulation review on MR quantitation. EROA from PISA and regurgitant volume computation. Advantages and disadvantages of methods.
- 3D versus 2D PISA studies. Documentation of geometric errors and the benefits of 3D measurement.
- 2021 ESC EACTS Valvular Heart Disease Guidelines. Contemporary, multiparametric approach to MR severity classification and decision making.
Bottom line
The PISA calculator turns color Doppler observations into quantitative MR severity metrics using well-established equations. Measure the radius precisely, set a clean aliasing velocity, capture reliable spectral data, and interpret EROA and RV within an integrated guideline framework. When geometry is off or the answer feels wrong, repeat the measurements, consider 3D PISA, and use corroborating methods before you act.