Gupta risk calculator (MICA) estimates a patient’s probability of perioperative myocardial infarction or cardiac arrest within 30 days of non-cardiac surgery using a validated NSQIP-derived logistic model. It’s faster and often more discriminative than legacy scores (e.g., RCRI) when you have the five inputs: age, ASA class, functional status, creatinine (>1.5 mg/dL threshold), and procedure category.
Use the tool below to get an instant probability and a clear risk band mapped to guideline thresholds (e.g., “low risk” <1% MACE).
Gupta Risk Calculator
Predicts 30-day risk of myocardial infarction or cardiac arrest (MICA).
Disclaimer
Explore more heart calculator:
What is the Gupta risk calculator (MICA)?
The Gupta risk calculator (also called NSQIP MICA) predicts the probability of myocardial infarction or cardiac arrest within 30 days after non-cardiac surgery. It was derived and validated on hundreds of thousands of NSQIP cases and published in Circulation (2011). In head-to-head analysis, its predictive performance surpassed RCRI.
The five inputs it needs
- Age (years)
- Functional status (independent, partially dependent, totally dependent)
- ASA class (I–V)
- Creatinine (binary threshold: > 1.5 mg/dL adds risk)
- Procedure category (21 site groups; e.g., aortic, brain, intestinal, orthopedic, vein, etc.)
The math (kept transparent)
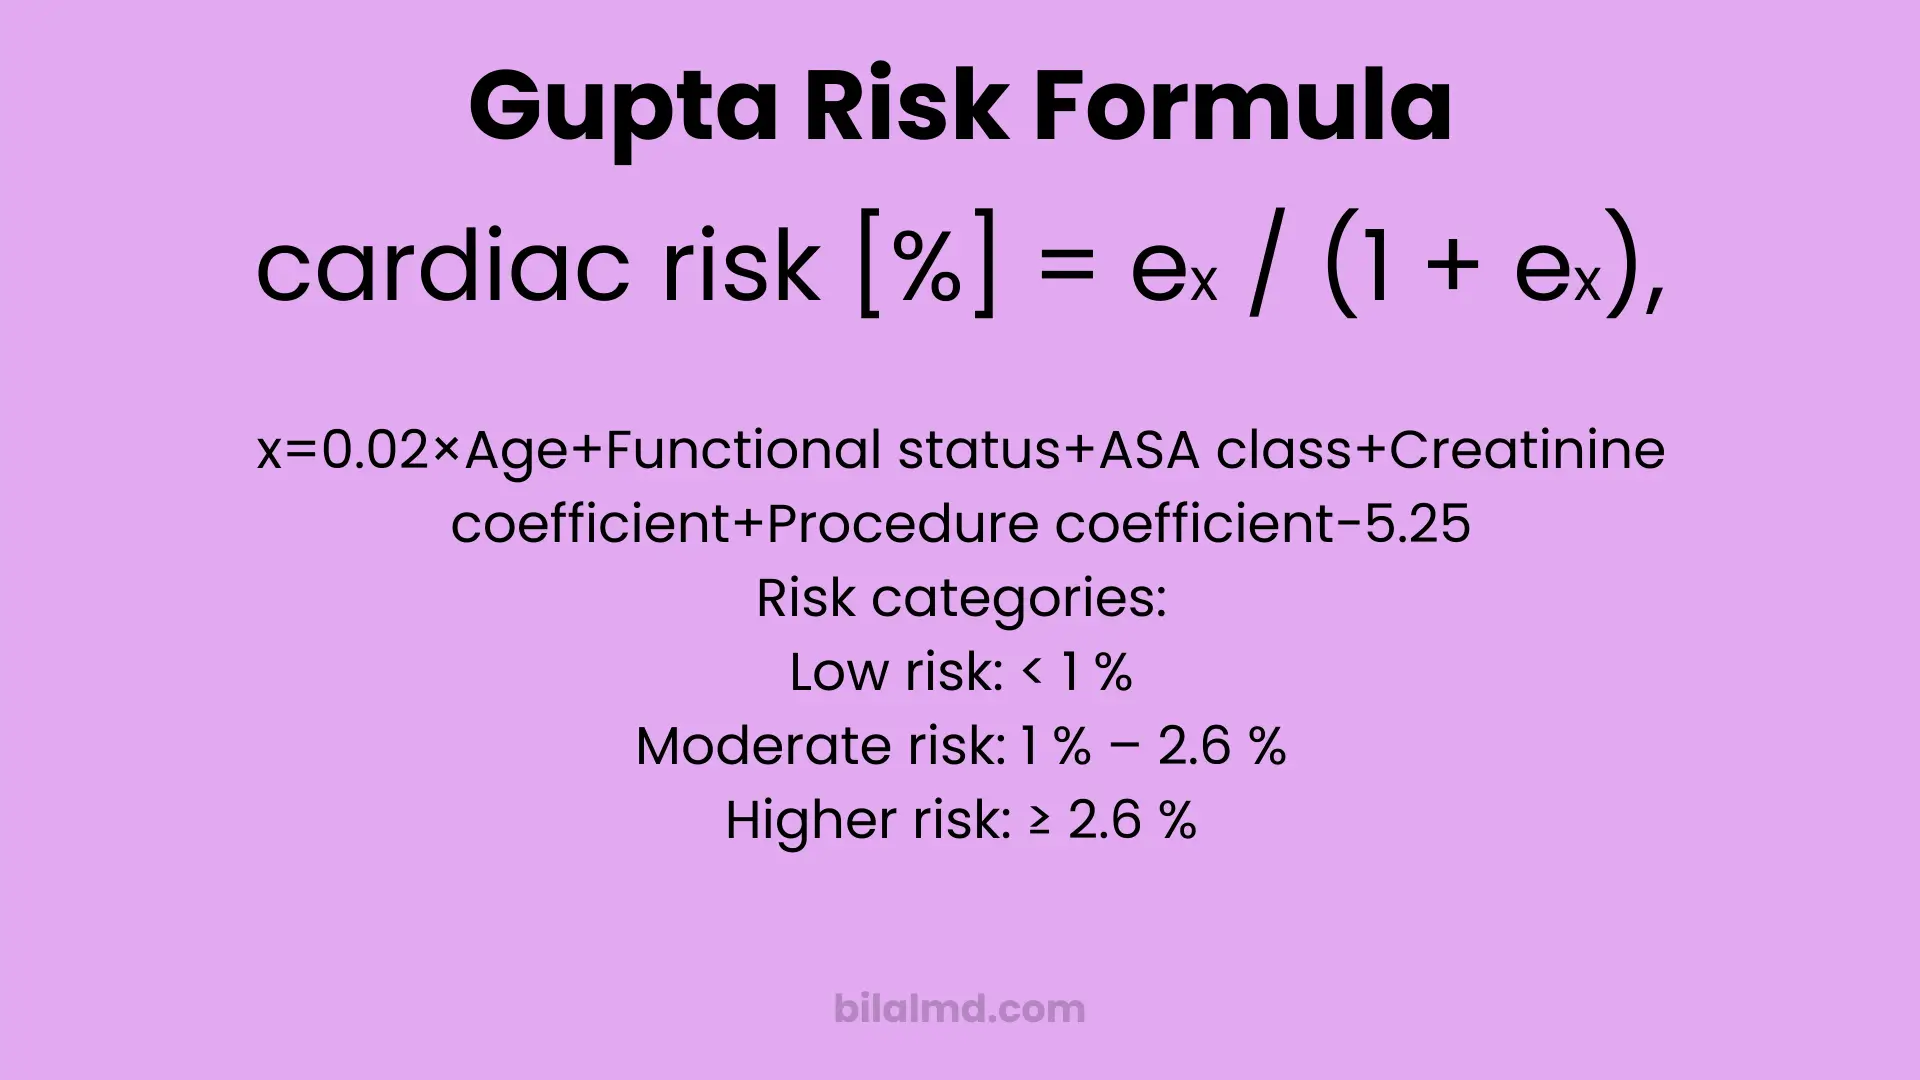
Logistic form: risk = e^x / (1 + e^x) wherex = 0.02 × Age + Functional + ASA + Creatinine(+0.61 if >1.5) + Procedure − 5.25.
Those coefficients match the original publication and widely used community implementations.
How to interpret the number
- < 1% → often treated as “low risk” (procedures with MACE <1% are “low risk” in ACC/AHA 2014).
- 1–2.6% → intermediate zone (between the guideline’s low-risk cut and the ~95th percentile of NSQIP MICA).
- ≥ 2.6% → higher relative risk (≥ ~95th percentile in the reference distribution).
Guideline context: Perioperative guidance was updated in 2024 (AHA/ACC et al.). Use clinical judgment, biomarkers, and team-based decision-making instead of fixating on a single score.
Why clinicians still use it
- Parsimonious: 5 routinely available items, no imaging required.
- Performance: Original work reported better discrimination than RCRI; multiple external studies continue to explore its utility across specific surgeries. Translation: it’s pragmatic when you need a probability fast.
Where our calculator is different (your page’s value prop)
- Immediate, readable output with the raw logit
xand exact formula shown for auditability. - Evidence-tied bands (Low / Moderate / Higher) aligned with guideline thresholds and NSQIP percentiles instead of arbitrary colors.
- Quality-of-life features: reset button, keyboard support, and inline Sources + Disclaimer so nobody mistakes probability for a decision.
(That transparency beats black-box widgets and improves trust with faculty, trainees, and clinicians.)
Step-by-step: using the calculator correctly
- Enter Age (years).
- Select Functional status accurately don’t over-call “independent.”
- Pick the correct ASA class from the pre-op note.
- Type Creatinine (use the latest value; threshold is >1.5 mg/dL).
- Choose the Procedure category closest to the planned operation.
- Click Calculate → read % risk and the risk band. If the number challenges your plan, escalate per local policy (pre-op optimization, cardiology consult, biomarkers, etc.).
Limitations (don’t ignore these)
- Calibration drift: Models trained on one era/system can mis-estimate absolute risk elsewhere; recalibration may be needed.
- Not a decision rule: ACC/AHA stress team-based judgment; the model supplements decisions, it doesn’t make them.
- Procedure coding matters: Picking the wrong category skews risk.
- Population fit: Some subspecialty cohorts show variable performance; check local data where possible.
FAQ
Is the Gupta risk calculator the same as the NSQIP Surgical Risk Calculator?
No. NSQIP/ACS has a broader calculator for multiple outcomes; Gupta MICA targets MI or cardiac arrest with 5 variables.
What counts as “low risk”?
ACC/AHA 2014 uses <1% MACE to define low-risk procedures; anything ≥1% is elevated risk and may warrant more evaluation depending on context.
Has guidance changed since 2014?
Yes. The 2024 AHA/ACC update emphasizes a stepwise approach, better use of biomarkers, and shared decision-making. Don’t use any calculator in isolation.
Where can I read the original study?
The 2011 Circulation paper by Gupta et al. describes development and validation on NSQIP data.
References
Gupta PK et al., Circulation 2011 (MICA model).
ACC/AHA 2014 perioperative guideline (defines <1% “low risk”).
AHA/ACC 2024 perioperative update (modern stepwise approach).
OmniCalculator (community coefficient table/implementation).
Evidencio (percentile distribution of MICA risk).
PubMed abstract noting MICA outperforms RCRI in original work; recent specialty-cohort validations.