If you work with exercise stress testing, you have likely seen the phrase duke treadmill score calculator on reports and websites. This simple scoring tool turns a treadmill test into a number that helps predict future cardiac risk. The idea is to combine how long the patient exercised, how much the ST segment moved on the electrocardiogram, and whether angina occurred. Used well, it gives a clear signal about prognosis and helps guide next steps. Used without context, it can confuse. This guide explains what the score is, how to calculate duke treadmill score accurately, how to interpret the ranges, and where clinicians can go wrong.
Duke Treadmill Score Calculator
Enter exercise duration, ST-segment deviation, and angina index to compute the Duke Treadmill Score. The score helps stratify risk after a standard exercise ECG.
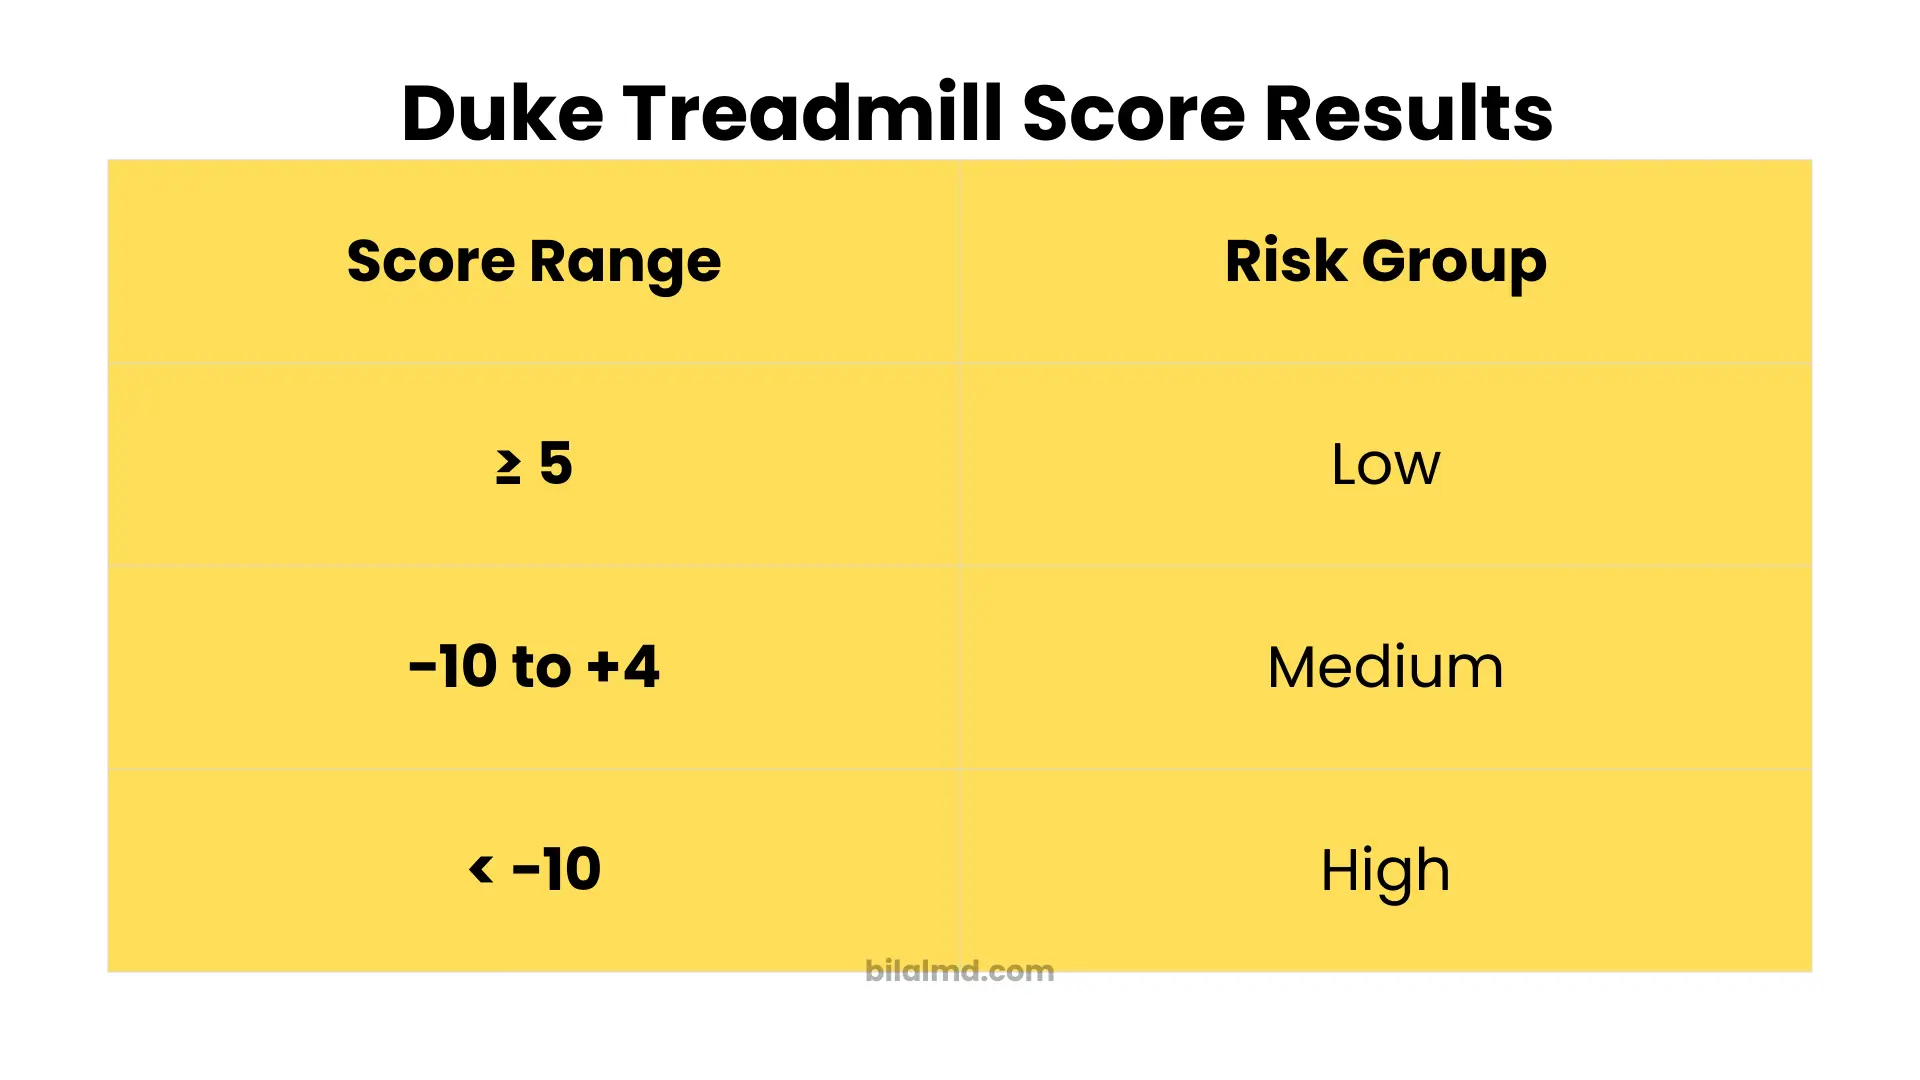
| Score | Risk group | Estimated 4-year survival |
|---|---|---|
| ≥ 5 | Low | ≈ 99% |
| −10 to +4 | Intermediate | ≈ 95% |
| < −10 | High | ≈ 79% |
This calculator is for education and clinical decision support. It does not replace clinician judgment, institutional pathways, or cardiology consultation.
Explore more heart calculator:
What the duke treadmill score calculator does
The duke treadmill score is a prognostic index developed at Duke. It uses three inputs from a standard exercise electrocardiogram. Those inputs are exercise time in minutes, the maximum ST segment deviation in millimeters during or soon after exercise, and a simple angina index that reflects whether chest pain was present and whether it limited the test. The original research and later validation showed that this single score sorts patients into low, intermediate, and high risk groups with very different survival curves.
The formula in plain language
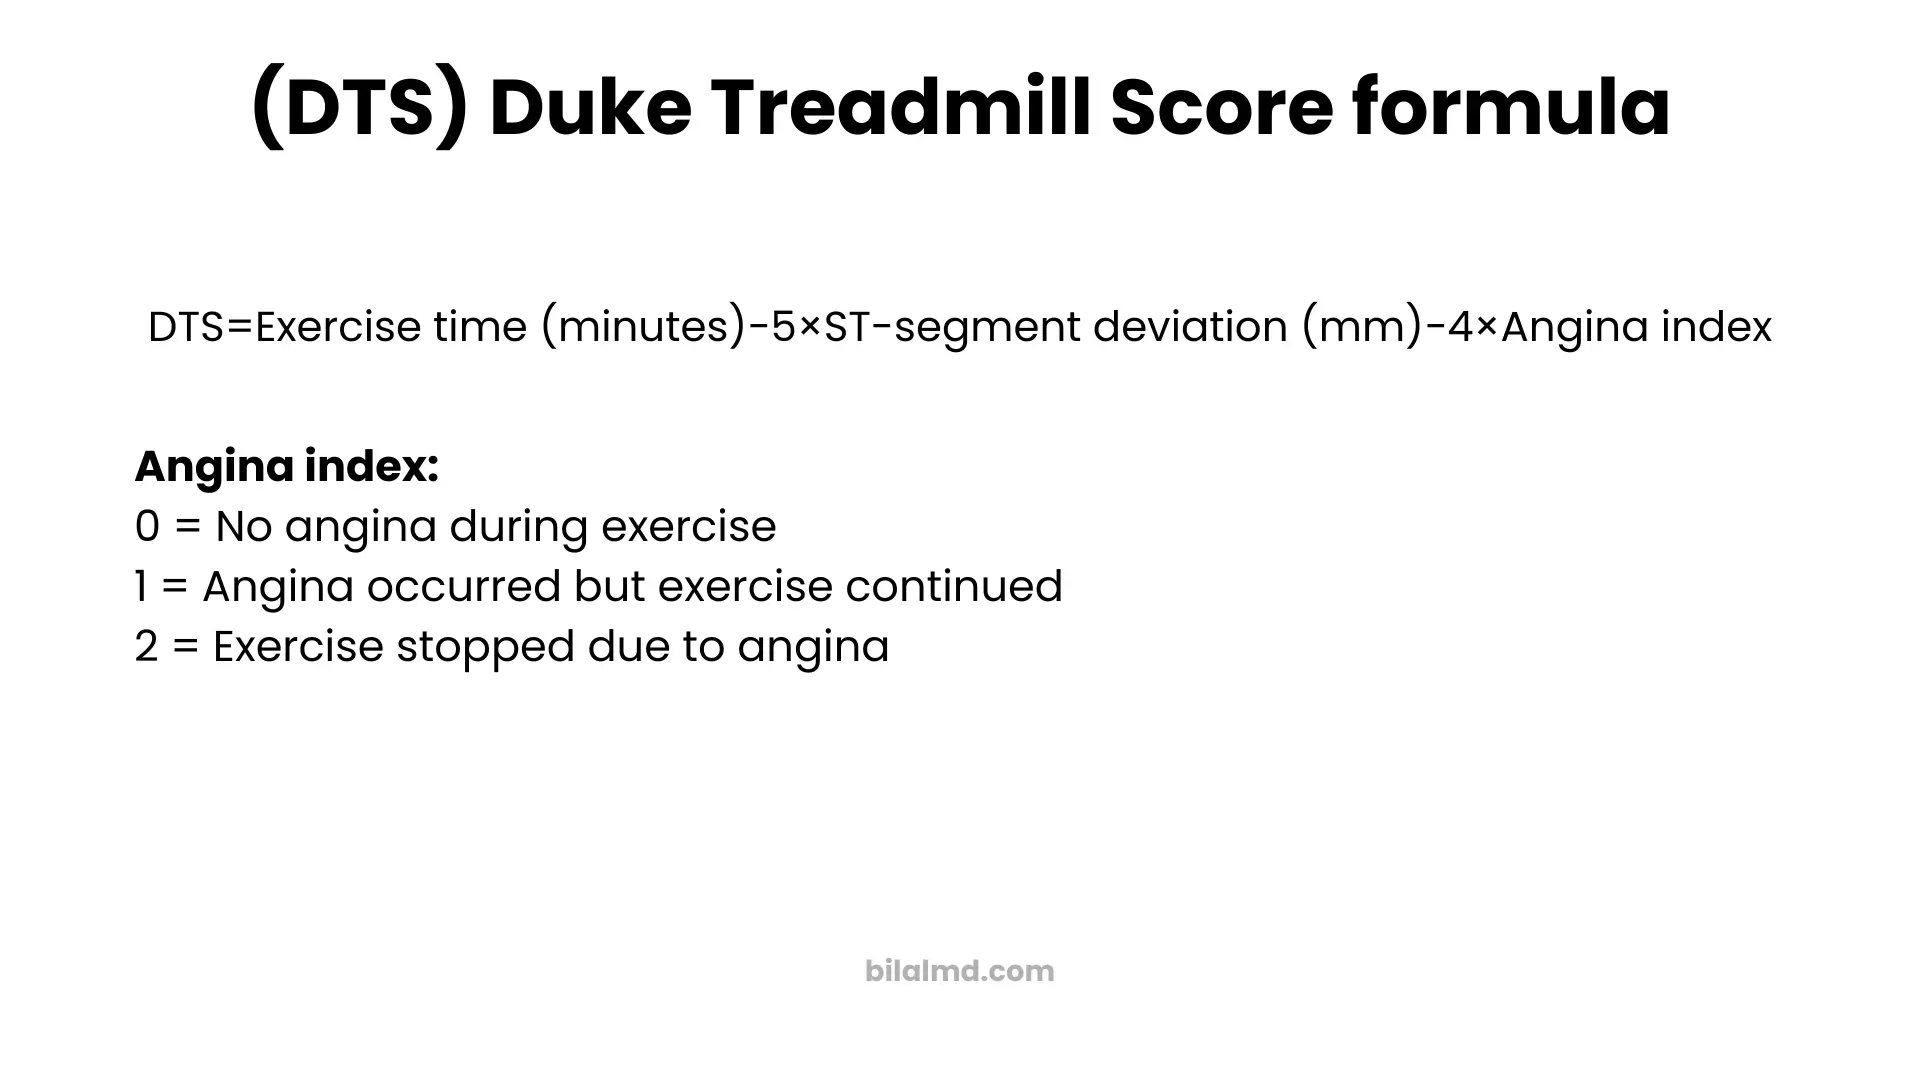
Here is the calculation described in words so you can use it at the bedside without a calculator. Start with the exercise time in minutes. Subtract five times the maximum ST segment deviation in millimeters. Subtract four times the angina index. The angina index equals zero when there is no angina during the test, one when angina occurs but does not stop the test, and two when the test is stopped due to angina. That is the duke treadmill score. The formula and the angina index definitions come directly from the original derivation and are repeated across trusted references.
Duke treadmill score formula
DTS=Exercise time (minutes)−5×ST-segment deviation (mm)−4×Angina index
Risk bands and what they mean
The final score maps to three widely used risk bands. A score of five or greater is low risk. A score from negative ten up to and including four is intermediate risk. A score less than negative ten is high risk. In the large outpatient validation from the early nineties, the low risk group had about ninety nine percent survival at four years, the intermediate group about ninety five percent, and the high risk group about seventy nine percent. Later cohort work and reviews report very similar cut points and outcomes, which is why most calculators and textbooks present the same ranges.
Why the score matters
Exercise duration captures overall exercise capacity. ST segment deviation captures ischemia on the electrocardiogram. Angina reflects symptoms during the test. Each piece alone is useful, but the combination is stronger than any one element. The score brings them together and gives clinicians a single number tied to real outcome data. That is why a duke treadmill score calculator is popular in clinics and on reputable medical sites.
How to calculate duke treadmill score step by step
Step one. Gather the inputs
Use the Bruce protocol time in minutes whenever possible, since most published cohorts used it. Record the maximum absolute ST segment deviation in millimeters, whether depression or elevation. Decide the angina index based on test notes. Zero means no chest pain during the test. One means chest pain was present but did not end the test. Two means chest pain stopped the test.
Step two. Do the arithmetic
Start with the time in minutes. Subtract five times the ST deviation. Subtract four times the angina index. That is the score. Most online tools perform the math for you, but it is worth understanding the parts so you can sanity check any result the moment it prints.
Step three. Read the risk band and plan next steps
If the result is five or more, the patient is in the low risk group with excellent short to medium term prognosis. If the result falls between negative ten and four, risk is intermediate and further evaluation depends on symptoms, comorbidities, and pretest probability. If the result is below negative ten, risk is high and additional testing or cardiology consultation is usually warranted. These ranges and the linked survival data come from classic validation studies and subsequent reviews.
Worked example without math symbols
A patient exercises for ten minutes on a Bruce protocol. The maximum ST depression is two millimeters. The patient notes chest pain but continues to the end. Start with ten. Subtract five times two, which is ten. That leaves zero. Subtract four times one for the angina index, which is four. The final score is negative four. This lands in the intermediate range. That means the result is not low risk and the clinician should consider additional testing based on the whole clinical picture. The cut points and interpretation follow the original studies and common clinical references.
When the duke treadmill score calculator is most useful
It shines in routine outpatient stress testing when the electrocardiogram is interpretable and the patient can exercise to a reasonable workload. It helps set expectations for prognosis and can reduce unnecessary downstream testing in clearly low risk results. It also helps identify high risk patients who may need a closer look or a different test strategy such as imaging or angiography. Review articles and professional journals present it as a pragmatic way to translate a treadmill trace into outcome risk.
When not to rely on it
The score is not a diagnostic test for obstructive coronary disease on its own. It is a prognostic index tied to outcomes. If the baseline electrocardiogram is not interpretable for ST segments, for example with left bundle or paced rhythm, then an exercise electrocardiogram without imaging is not appropriate and the score is not applicable. If the patient cannot exercise, if they stop for noncardiac reasons very early, or if there is a safety reason to avoid exercise testing, the score does not apply. If symptoms or pretest probability strongly suggest high risk disease, do not use a treadmill score alone to reassure. These cautions echo clinical reviews and policy discussions.
Frequently seen reporting details
Reports usually include the raw time, the maximum ST deviation, the angina index, and the calculated score. Many labs also list metabolic equivalents achieved and heart rate recovery, which add further context. Some large studies show that heart rate recovery and the duke treadmill score both carry prognostic information, which is why they often appear together on reports.
Common pitfalls that change the score
One common error is to plug in the wrong sign for ST segment deviation. The score uses the magnitude of deviation, not the direction. Another error is to forget that angina which stops the test counts more and therefore subtracts more. A third is to mix time units. The score expects minutes, not seconds. Cross check the numbers before you sign off. The derivation and validation papers describe the inputs clearly and a good duke treadmill score calculator follows them.
How the score compares with other tools
The score does not replace clinical judgment, imaging, or modern risk engines for prevention. It is focused on information from the exercise electrocardiogram. Many clinicians pair the score with their preferred risk calculator for long term prevention, or with imaging tests when the clinical question is diagnostic rather than prognostic. Reference sites place the duke treadmill score alongside other calculators for this reason.
Using a duke treadmill score calculator in day to day care
In primary care and cardiology clinics, the flow is straightforward. You gather the time, measure the maximum ST shift in millimeters, decide the angina index, and enter the values. The tool returns a score and labels the risk as low, intermediate, or high. From there you decide on next steps based on symptoms and pretest probability. For many low risk patients with good exercise time, minimal or no ST shift, and no limiting angina, the score supports conservative management and risk factor control. For high risk scores, the tool reminds the team that this stress test points toward a higher event rate and that more evaluation is prudent. This is exactly how the large cohorts and later reviews positioned the score, and it is why the calculator remains in daily use.
Practical tips to avoid confusion
Write out the three inputs before you calculate. If the number looks off, check that you used millimeters for ST segment deviation and the correct angina index. Remember that time drives the score strongly. A long exercise duration boosts the number and usually signals good prognosis. If the patient is deconditioned and stops early for noncardiac reasons, the score will be poor even without ischemic changes, so add clinical context. Use the score to inform, not to replace, a conversation with the patient. These points match how experts and reference sites teach the tool.
Quick reference table
Low risk equals a score of five or more. Intermediate risk equals a score from negative ten to four. High risk equals a score less than negative ten. Survival at four years in the classic outpatient validation was about ninety nine percent for low, about ninety five percent for intermediate, and about seventy nine percent for high. Later studies over longer horizons show the same ordering of risk. If you forget the numbers, a reputable calculator will display them under the result.
FAQs based on real world questions
What is a good duke treadmill score
A good score is five or more. That falls into the low risk band with excellent four year survival in the original outpatient validation.
Is a score of zero low risk or intermediate risk
Zero is inside the intermediate range, which spans from negative ten to four. Plan follow up based on the whole clinical picture. Clinicians and patients discuss this point often in online forums.
How do I calculate duke treadmill score without a website
Use the plain language method. Start with the time in minutes. Subtract five times the maximum ST segment deviation in millimeters. Subtract four times the angina index where zero means no angina, one means angina that does not stop the test, and two means the test stopped for angina. This comes straight from the derivation paper.
Does the score work for women and men the same way
The formula is the same for all adults who can do a standard exercise electrocardiogram. Some cohorts have explored differences in predictive value by sex, but the published cut points are the same and are used in routine practice. Use clinical judgment if there are confounders such as baseline electrocardiogram abnormalities or limited exercise capacity.
What else should I look at besides the score
Look at symptoms, blood pressure response, heart rate recovery, and the overall exercise capacity in metabolic equivalents where available. Several studies show that heart rate recovery and the duke treadmill score both predict outcomes, so a full report tells the best story.
My report says negative one and calls it intermediate. Is that normal
Yes. Negative one lies in the intermediate band. Many users on social forums ask about a single number like negative one or plus four. The right action is to review the entire test and talk with your clinician about next steps rather than fixate on the label alone.
Can the score tell me if I have a blockage
No. It is not a diagnostic tool by itself. It is a prognostic index that estimates risk of future events based on treadmill test performance and electrocardiogram changes. Diagnosis of obstructive disease may require imaging such as nuclear stress imaging, stress echocardiography, computed tomography angiography, or invasive angiography depending on the case. Reviews in major journals emphasize this distinction.
Is there a best duke treadmill score calculator online
Several reputable medical reference sites host calculators that implement the original formula and risk bands. These sites clearly list the inputs, show the ranges, and often include short teaching notes. Use a trusted source that cites the original literature rather than a random tool with no references.
Bottom line
A duke treadmill score calculator turns three pieces of a standard exercise electrocardiogram into a single number that helps you talk about prognosis with confidence. The method is simple. Start with time, subtract the ST change scaled by five, subtract the angina index scaled by four. Then read the risk band and decide on next steps with the whole clinical picture in mind. The score has stood the test of time through derivation, validation, and decades of practice, which is why it remains a fixture in clinics and on trusted reference sites today.